
Posted by Michael Stopa on 28 February 2023
Tags: C++, CoreWeave, GDB, Kubernetes, Pixel Streaming, Unreal Engine
Debugging is a fundamental part of being a software engineer. When working with software in the cloud, however, an engineer often doesn’t get the luxury of being able to reliably reproduce an issue locally. One may be able to glean the result of a crash from a core dump, but if a deployed application simply freezes and reading through runtime logs provides no clue as to the issue then it is extremely useful to be able to attach some sort of debugger to the process in order to get an immediate insight into the state of the program when it begins to misbehave.
At TensorWorks, much of the software we write is expected to be deployed to a variety of architectures and we can receive bug reports from all manner of cloud infrastructure. As a newly hired engineer, one of my first assigned tickets was a persistent lockup being reported when running Pixel Streaming in a Linux container on CoreWeave. I had just resolved what seemed like a similar issue to that reported by the client, but could not get the lockup to trigger by simply running project like in the client’s report. In the interest of confirming the issue and thus whether my proposed fix would actually work on the client’s setup, I set off into what was unknown territory at the time for most of the team: connecting to a GDBServer instance, running an Unreal Engine project with Pixel Streaming, hosted on a CoreWeave Kubernetes Pod. And with the help of a group of my colleagues all drawn from different teams at the company, we managed to confirm and solve the lockup.
Contents
- Diagnosing a Multi-Threading Lockup with GDB
- Deploying to CoreWeave
- Remote Debugging with GDBServer
- Conclusion
Diagnosing a Multi-Threading Lockup with GDB
Our journey begins with what at the time was an unrelated issue. Through internal testing I’d been able to determine that opening a tooltip near the edge of the window when running Editor Pixel Streaming on my Linux machine at work would reliably cause a lockup. Without any further information provided by Unreal Engine’s logs at the time of the freeze, my next step was to recreate the situation while running the project in a debugger. Personally, I prefer using GDB directly in the terminal when debugging enormous programs such as Unreal Engine. Most graphical debuggers are simply frontends to GDB anyway so sometimes it helps to be able to cut out the middleman.
Multi-threading often tends to give rise to two types of bugs: data-races and deadlocks. The former can lead to all sorts of strange behaviour in your program or (if you’re lucky) segmentation faults, neither of which are symptoms that you might immediately associate with multi-threading issues. Deadlocks however can be quite a lot easier to diagnose: the program (but usually not the operating system) simply freezes up and won’t respond to any stimulus or give any output. In our case I was getting the latter, which could be diagnosed by simply pausing the debugger once the program had frozen anyway (Ctrl+C in the terminal) and inspecting the state of the program threads at that point.
Unreal Engine may be something of a more extreme example, as there are often over a hundred different threads to look over, but the process is still the same. If you can find two threads, each having acquired a mutex in a lock further down the stack, which are then further up the stack trying waiting to acquire the mutex already held by the other thread, you’ll have found your deadlock. As a first pass, try entering info threads into the (gdb) prompt once the program has frozen and look for threads (especially the main and render threads) that happen to be sitting in some sort of lock or sleep function or even just in an unidentified part of the C/C++ standard library.
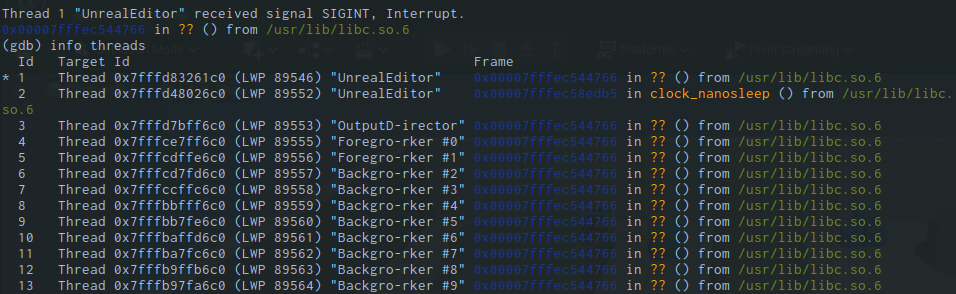
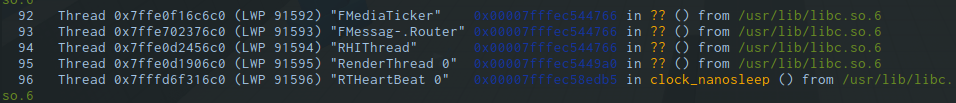
RenderThread most of the way down the list, sitting suspiciously on an anonymous instruction within libc.
Switching GDB to one of these threads with thread 42 (where 42 is the thread number from the list above) allows you to then view the current stack trace by typing info frame. What you’re looking for in this case is to have one frame relatively close to the top sitting in FScopeLock::FScopeLock (Unreal Engine’s constructor for a scoped mutex lock) and then another frame some distance further down also in FScopeLock. This also applies to Linux in general where you’d be looking for pthread_mutex_lock, which FScopeLock wraps around anyway.
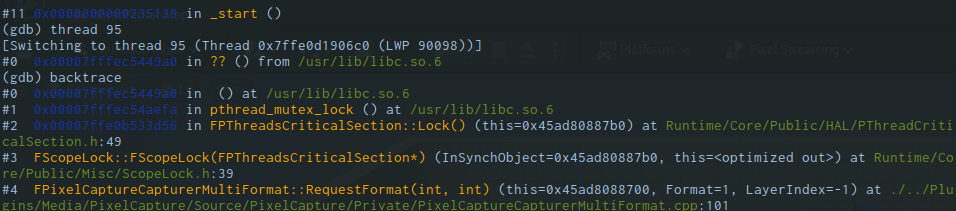
To identify that this is indeed a deadlock you should also check the memory address of the mutex object being locked each time. In this case we want to switch our current stack frame to the one with a FScopeLock running and check the address the of the FCriticalSection being locked. What you’d generally be looking for, and what I found in this example, is that there will be two threads competing for the same two mutex objects. The second lock attempt (the one that fails) will be obvious at the top of the stack trace.
FormatGuard isn’t often very helpful, it’s much more useful to note down the mutex object’s address so it can be compared to already acquired mutex locks on other threads.
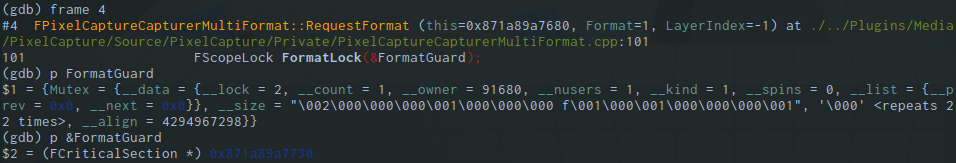
For the first (successful) lock on each of the competing threads, you’ll have to do a little digging in the vicinity of calls further down the stack. In this particular case the other mutex object being locked was a few lines further back from where the stack frame was pointing.
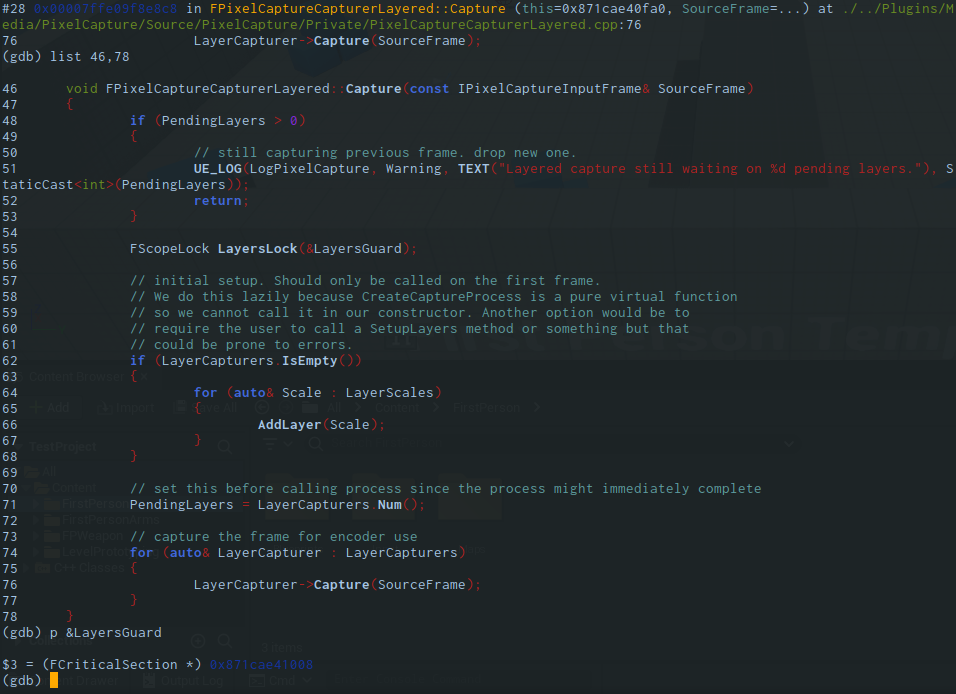
LayersGuard. Its address, plus that of the FormatGuard the thread is also attempting to lock at the top of the stack, correspond to the same two mutex objects also being contested by another thread, EncoderQueue in this case.
Repeating this process on another thread should reveal the same two mutex objects but locked in opposite order. For this problem, the resolution was as simple as ensuring both threads capture both mutexes in the same order. In this case we had one thread capturing frames from the render buffer locking a format mutex and a compositing layer mutex in one order, while another thread encoding the previously captured frames was acquiring them in the opposite order. Our solution was to take advantage of recursive locks to simply have one thread lock the compositing layer mutex well ahead of when it really needs it. In Unreal Engine, the mutex primitive wrapper class, FCriticalSection, has recursive locks enabled by default where possible.
Deploying to CoreWeave
Job well done! We’d resolved a deadlock and could move on to the next ticket. We’d received a report from a client using Pixel Streaming to run a packaged project on CoreWeave that the application would invariably lock up given only time. Though there was no immediately obvious trigger, having just dealt with a multi-threading problem with similar symptoms meant it was at least worth ruling out that it wasn’t the same issue just being encountered in a different way. Reproducing the issue on a local machine proved fruitless; a packaged project could run for hours and never lockup. This meant needing to fully recreate the environment the client had. The challenge now was that I was myself quite unfamiliar with how containers and clusters worked, so along with our QA Lead Michael Wallace the two of us got a crash course on how to deploy the project to CoreWeave from one Adrian Zahra, a member of the Scalable Pixel Streaming team.
As we had a CoreWeave cluster already set up, this article won’t go into the process of doing so, however I’ll note that you do need kubectl installed locally in order to communicate with the cluster. We also use OpenLens to have a GUI overview of the status of the entire cluster and all of the Pods running inside of it. Adrian handled getting both of our machines configured to be able to access CoreWeave (myself on Linux, Michael Wallace on Windows) and thereafter walked through the report submitted by the client to reproduce their issue.
The first step is getting a packaged Unreal Engine project onto the cluster in the first place. As it’s the only method CoreWeave really understands, you have to do this as a separate job (or “Pod” in Kubernetes terminology) in the cluster. Such Pods are configured by writing a configuration file in YAML to assign resources and capabilities to the instance running the job. For this “data-copy” job, it’s really only important that the Pod be assigned the bare minimum amount of CPU cycles, RAM, and enough storage to fit the entire project with some wiggle room (10GB is usually enough for a bare-bones packaged Unreal Project). The command then executed by the Pod is simply an infinite sleep to make sure the Pod is registered as doing something and not immediately recycled or restarted.
Once you have a data-copy Pod up and running on the cluster, fire up a terminal, cd to the directory containing your packaged project and execute the following to upload the project:
kubectl cp ./ProjectName data-copy:/data/
Depending on your internet connection speed the upload can take quite a while. A bunch of us work from home, myself included, and while my download speeds are as advertised my uploads leave a lot to be desired so I had to leave this one running overnight.
Once completed it was time to set up another Pod to actually run the project. Because we’re trying to use Pixel Streaming, this second Pod needs to have two different containers: one to run the project itself and another to run the signalling server so we can connect to the Pod over the internet and get a functioning stream to the browser. To speed things up regarding dependencies, we use existing container images from GitHub Container Registry with a compatible environment for running each:
ghcr.io/epicgames/unreal-engine:runtime-pixel-streamingis a base image for running Pixel Streaming Projectsghcr.io/epicgames/pixel-streaming-signalling-server:5.1includes a functioning Signalling Server already set up
In order for the packaged project to run as expected there’s a bunch of extra command line arguments needed to enable and configure Pixel Streaming. In this case we were running a project built against Unreal Engine version 5.1 with the following set of arguments (keep in mind these can change with new releases):
    args:
    - cd /home/ue4/project && ./ThirdPersonTemplate.sh
      -Vulkan
      -Unattended
      -RenderOffScreen
      -FullStdOutLogOutput
      -LogCmds=PixelStreamingWebRTC Verbose
      -AllowPixelStreamingCommands
      -ResX=1920 -ResY=1080
      -PixelStreamingURL=ws://localhost:8888
Once the Pod is up and running it’s as simple as connecting to its IP address to confirm that the signalling server is working and you can get Pixel Streaming input and output through your browser. A few minutes later we already had the project freezing, exactly as had been described by the client’s report. Notably, I’d created the project with the public release of Unreal Engine, without the fix from the previous ticket applied. At this point if I was so confident in my fix it would have made sense to just try another project with the fix applied and compare, but I wanted to to be absolutely sure.
Remote Debugging with GDBServer
This time the plan was to try out remote debugging. And so, GDB enters the stage once again, but this time accompanied by GDBServer, with which a local gdb instance can debug a program running on a remote machine. The basic concept is pretty simple, the remote computer running the program to be debugged launches using gdbserver :2345, while the local computer runs gdb and connects to the remote gdbserver instance by running target remote <ip address>:2345, where <ip address> refers to the address of the machine running the server. To adapt this for use on CoreWeave I turned to Adam Rehn who had previous experience working with GDBServer. With his help, I modified the YAML file to launch gdbserver instead of the project itself:
    args:
    - >-
      cd /home/ue4/project && gdbserver :2345 "`pwd`/TestProject/Binaries/Linux/TestProject"
      -Vulkan
      -Unattended
      -RenderOffScreen
      -FullStdOutLogOutput
      -LogCmds=PixelStreamingWebRTC Verbose
      -AllowPixelStreamingCommands
      -ResX=1920 -ResY=1080
      -PixelStreamingURL=ws://localhost:8888
It’s also important at this point to modify the Dockerfile that CoreWeave is using for this Pod to also have gdbserver installed because it usually isn’t part of a standard image. It’s also important to note that the above example has gdbserver launch the Unreal Engine project’s Linux binary instead of the regular launch script. This is important not just for remote debugging but local as well, as running gdb on the script will create a session debugging the system’s bash shell running a script which then launches the Unreal project itself. It’s possible to switch to the correct process after the shell forks but this requires some experience with how the shell works under the hood and it is much, much easier to cut out the middleman and run the binary directly. Most of what the shell is doing is ensuring the project is being run from the correct root directory which you can model yourself using cd anyway.
Pitfalls with symbol loading
A neat feature of gdbserver is that while it will default to sending you debug symbols over the internet during a session, you can pre-emptively gather those symbols from a local copy on the machine running the gdb client. For smaller codebases this isn’t particularly useful, but for a monstrously huge program like Unreal Engine this can be an absolute lifesaver.
In this case it’s usually as simple as running file path/to/executable.debug before connecting to the remote target. I typically automate this sort of thing with a local .gdbinit file in the directory I’m running gdb from. Often for system binaries and hardware interfaces gdb will insist on receiving the remote copy over the network anyway, but you can minimise some of the transfers by running set auto-solib-add off to turn off automatic loading of symbols from dynamic libraries.
Conclusion
In the end, debugging the project on CoreWeave lead to the exact same deadlock situation I’d seen beforehand. To then also confirm that the deadlock was the only issue, I uploaded a new project to the cluster with the fixes applied from the other ticket and left it running overnight, confirming that everything was working fine. And so, as of writing, the deadlock fix for Pixel Streaming has shipped with Unreal Engine 5.1.1. (Note: you will need to be a member of the EpicGames organisation on GitHub to view the commit through the provided link.)